Supply Chain Data Governance

By 2020, Supply Chain Data Governance would be a phenomenon your company must adopt in order to survive in the supply chain market. The companies who would invest in Data Governance will continue on in efficiency, carrier satisfaction, supplier satisfaction, customer satisfaction, end-customer satisfaction and competitiveness. The companies that don’t will be left behind.

Why do you need a Maintenance Performance Management System (MPMS) ?

60 % of the overtime in a company is related to machine breakdowns.  The average resolution time per breakdown is around 200 minutes.

If you want to ‘predict’ your maintenance activities or you want to react more ‘proactive’, you can integrate a Maintenance Performance Management System (MPMS).

More information needed ? Check out  our new Datalumen eBook on Maintenance Analytics! http://ow.ly/T4G75 

maintenance_qv2

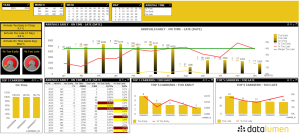
Analyze your carriers to avoid high costs. Supply Chain Insight @ Datalumen (www.datalumen.eu)

arrival_analytics

Analyze your carriers to avoid high costs.  Do you want to know more ?  Contact us : www.datalumen.eu Datalumen is specialized in : Supply Chain Insight – Customer Intimacy – Data Governance – Product Transparency – Data Protection

Follow us at twitter : https://twitter.com/datalumen

Follow us at LinkedIn : https://www.linkedin.com/company/1212600?trk=tyah&trkInfo=clickedVertical%3Acompany%2Cidx%3A1-1-1%2CtarId%3A1431891329668%2Ctas%3Adatalumen

Follow us at Facebook : https://www.facebook.com/pages/Datalumen/1398795037111346?fref=ts

Follow us at Google+ : https://plus.google.com/u/0/107104440626461082244/posts

Customer profitability : make better decisions by implementing a Time Driven Activity Based Costing model.

TDABC_MAPAD

1. Are your customers profitable enough ?

At least once a month, every logistic/supply chain manager has to struggle with the following question :

What’s the profitability of our customers or which logistic activity is the most profitable ?’.

And if we are honest, we want to know the answer ‘day-to-day’, because it gives us the possibility to ‘act’ and to ‘improve’ before the end of the month.

Analyzing and measuring your logistic processes in detail, will deliver you the figures you can use in a Time Driven Activity Based Costing Model (simply abbreviated as TDABC). But what does it means ?

2. Meaning of a Time Driven Activity Based Costing Model

A TDABC – model shows you the total handling costs per logistic activity (based on the tariff-structure you agreed with your customer(s)). The total handling costs will be calculated with the following ‘aspects’ :

  • Total time you needed to despatch your logistic activity (time in this case is the result of time studies you’ve done in the past)
  • Total units you have to handle (f.e. How many full pallets out ?, How many cases to pick ?)
  • Staffing costs per logistic activity

Formula :

TOTAL TIME * TOTAL UNITS * STAFFING COSTS

This will be a very good theoretical approach, because the time and staffing costs are ‘average’ figures based on measurements, you’ve done in the past.

3. Theory versus practice

Above, I’ve written a theoretical approach, but when your company have a Timeregistration system which registrates every logistical activity, we can calculate (near real-time) the total cost per activity. So it’s possible to analyze the deviations between the theory and the actuals.  In the following presentation (slideshare) you can discover 3 possibilities we can integrate in your Management Information System.

Discover now : TDABC

Enjoy this post and the slideshare-presentation. Til the next post.

Optimize your warehouse capacity by analyzing your storage and by using the ‘MAPAD’ methodology

As I mentioned in my earlier post, a new methodology was founded by me, namely the MAPAD-methodology.

MAPAD stands for :

  1. Measure
  2. Analyze
  3. Predict
  4. Act
  5. Decide

With this methodology, combined with SCM analytics, you can optimize your warehouse capacity. Do you want to know how you can optimize it ? Read my post !

First step : Measure :

First of all, you start with the ‘descriptive analytics’-part. The following measurements can be taken :

  • Number of pallets  stored on the wrong locations.
  • Number of locations per ‘type of pallet’ as defined in your warehouse management system.
  • Number of locations divided per type of pallet, per height and per warehouse part/zone( like : ambient, maturation, refrigerator, frozen storage, quarantine, quality,…)
  • Number of free locations, blocked locations, locations in use for storage, picking, …

After taking all those measurements, you can analyze the results.

Second step : Analyze :

The second step to take is the ‘analyzing step’. This is the ‘inquisitive of diagnostic analytics’ –part.

1.  Why do you find pallet A on the wrong place in your warehouse ?

Possible reasons :

  • In the past, the storage rules were overruled in the warehouse management system.
  • The item specifications master data isn’t right (wrong zone, wrong measurements of your packaging material, wrong pallet type, …)
  • Right storage locations (right pallet type, right height,…) aren’t foreseen in the needed storage zone.
  • At inbound allocation, the reach truck driver put the pallet on a wrong place (not foreseen at inbound).

2.  Why are there a lot of free locations in a certain warehouse zone ?

Possible reasons :

  • There are some mistakes in your parameters in the warehouse management system.
  • Some locations could be blocked in the past for a certain reason, and after the reorganization you haven’t given free those locations.
  • The pallets to storage are higher than the height of your free locations.
  • The pallets to storage are stacked on another pallet type as mentioned in your item specifications.
  • The storage rules for a certain item isn’t defined in the right zone.

Third step : Predict :

The next step you have to take is the ‘predictive analytics’-part. You have to set up some realistic ‘What – If’ scenes.

For example :

1.  What if you change the storage rules ?

  • Will this solve your problem of having a lot of free locations in a certain zone ?
  • Will the system define the right locations for storage of your pallets at inbound ?
  • Do you have enough locations of a certain height ?
  • Is the number of your pick locations big enough ?
  • Which ratio (between small pallets and big pallets) will be the most efficient ?
  • ….

2.   What if you move the ‘wrong pallets’ to the right zone ?

  • How long will it take to move the pallets ?
  • How tall are the removing expenses ?
  • What will be the benefits after a couple of days ?
  • You can try to make a comparison between the total ‘removing’ cost and the benefits from the ‘new storage handling’ .

Fourth step : Act :

The ‘act-step’ is the prescriptive part of SCM analytics.

When you have decided to change the storage rules, you can change this in your warehouse management system, so after the adjustments, you can monitor the stored pallets.

You can analyze the evolutions of your handling costs, storage handling benefits, … And if you established the pallets, stored in your warehouse are not the types your customer promised in the contract, you can draw attention to your customer.

After two weeks, you will analyze again and normally, when you have taken the right decisions, your benefits will increase, your handling costs will decrease.

Fifth step : Decide :

In SCM analytics this step of making decisions is called : ‘pre-emptive’ analytics.

If you have analyzed only one zone in your warehouse, you can start with the investigation of the other zones. It is possible, you have to build another warehouse building after a while. For example in case your customer will increase the total number of orders, total number of receivings, …

Which tools you can use to analyze your ‘warehouse capacity’ ?

SAS visual analytics

QlikView

Microsoft BI

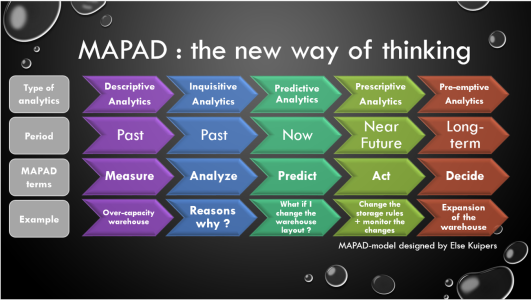
MAPAD : the new way of thinking

Today, a new way of thinking is born. I’ll introduce the MAPAD-method you could use to analyze your business processes. It is a method you have to integrate step by step : ‘starting with a measure and ending with a long-term decision’.

MAPAD represents the following steps :

  1. – Measure
  2. – Analyze
  3. – Predict
  4. – Act
  5. – Decide

In my next blog, I will describe how you can optimize your warehouse with integrating the MAPAD-method.

See also the scheme below (with an example of storage over-capacity in a warehouse) :

MAPAD


Optimize your business processes by integrating SCM Analytics

Supply Chain Management Analytics offers more value than a Supply Chain Management Information System because it helps to optimize your business processes and answers questions that enable the business to analyze the past, optimize the present, predict the future and test core assumptions.

A very important question is the following : ‘Where does it make sense to apply Supply Chain Management Analytics in your company ?

It’s best to apply SCM Analytics to data-intensive business processes that are sub-optimized due to built-in constraints, such as lack of time, people, money,… SCM Analytics only makes sense when the business upside is big enough and the data complex enough to justify the costs.

In the ‘Big Data’ Supply Chain Business world, we can detect also the 5 types of analytics (I’ve already mentioned in my blog about Retail Analytics) , namely :

  • Descriptive analytics
  • Inquisitive analytics (also mentioned as Diagnostic analytics)
  • Predictive analytics
  • Prescriptive analytics
  • Pre-emptive analytics

Each type of those analytics contributes to the objective of improved decision-making. SCM Analytics makes it easier to uncover, anticipate and prevent potential risk factors. It can improve your supply chain performance by making everything more transparent and measurable, while exposing variability as well as potential issues and opportunities.

The SCM Analytics scheme :

SCM ANALYTICS


Descriptive analytics (learn from past behavior to influence future outcomes) :

Descriptive analytics helps your company to understand what happened in the past. The past can be from one minute ago to a few days, a few weeks, a few months or a couple of years back. Descriptive analytics helps to understand the relationship between customers, carriers, suppliers and products and the goal is to gain an understanding of which approach to take in the future.

This type of analytics is an important source to determine what to do next. Descriptive analytics looks at data to describe the current situation in such a way that trends, patterns and exceptions become apparent.

Some examples of descriptive analytics :

  • Reports
  • Dashboards
  • KPI-platform
  • Management information system (MIS)

Inquisitive analytics (or Diagnostic analytics) :

We use this type of analytics to validate or to reject the different business hypotheses. Inquisitive analytics has to give an answer on the question : ‘Why did something happened at a certain moment in the past ?

Some examples of inquisitive analytics :

  • Statistical analysis
  • Factor analysis

Predictive analytics (about the future) :

Predictive analytics provides an estimation regarding the likelihood of a future outcome in your supply chain process, also it can help to identify some risks or opportunities in the future. Predictive analytics can be done by using a technique like :

  • data mining
  • modelling

No matter what, you still need business intelligence or in the terms of analytics, you still need descriptive analytics to know what really happened in the past, but you also need predictive analytics to optimize your processes and resources as you look to make decisions and take actions for the future. Predictive analytics takes the questions that descriptive analytics is answering to the next level, moving from a retrospective set of answers to a set of answers focused on process performance and prescribing specific actions or recommendations.

Prescriptive analytics :

With prescriptive analytics you try to see what the effect of future decisions will be in order to adjust the decisions before they are actually made. It provides advice based on the outcome of your predictive analytics.

An example of Prescriptive analytics :

  • What – if analysis : what will happen when I change my process ?

Pre-emptive analytics :

Pre-emptive analytics is using to have ability to take preventive actions.